
Author
Edward Tufte
Born 1942
An American statistician and professor emeritus of political science, statistics, and computer science.
Wikipedia. Bibliographic data from Open Library.
Books by Edward Tufte
Most-read first
The Visual Display of Quantitative Information
Edward R. Tufte, 1983
Envisioning Information
Edward R. Tufte, 1990
Visual Explanations
Edward R. Tufte, 1997

Beautiful Evidence
Edward R. Tufte, 2006
The Quantitative Analysis of Social Problems
Edward R. Tufte, 1970

The Cognitive Style of Power Point
Edward R. Tufte, 2003
Data Analysis for Politics and Policy
Edward R. Tufte, 1974

Political Control of the Economy
Edward R. Tufte, 1978
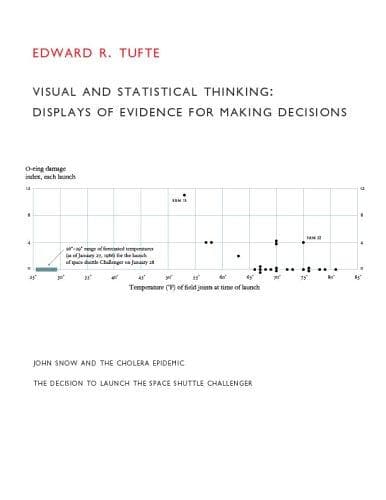
Visual & Statistical Thinking
Edward R. Tufte, 1997
- Seeing with Fresh EyesEdward R. Tufte
Seeing with Fresh Eyes
Edward R. Tufte, 2020
- Size and DemocracyRobert A. Dahl & Edward R. Tufte
Size and Democracy
Robert A. Dahl & Edward R. Tufte, 1974
- Visual Design of the User Intergace...Edward R. Tufte
Visual Design of the User Intergace...
Edward R. Tufte, 1989
- Electoral ReformEdward R. Tufte
Electoral Reform
Edward R. Tufte, 1974
- Seeing aroundEdward R. Tufte
Seeing around
Edward R. Tufte, 2009
- All Possible PhotonsEdward R. Tufte
All Possible Photons
Edward R. Tufte, 2012
- Visual Design of the User InterfaceEdward R. Tufte & IBM Design Program
Visual Design of the User Interface
Edward R. Tufte & IBM Design Program, 1989
- The Visual Display of Quantittive InformationEdward R. Tufte
The Visual Display of Quantittive Information
Edward R. Tufte, 1983
- The Visual Display of Quantitative Information by Edward R. Tufte (1983-12-23)Edward R. Tufte
The Visual Display of Quantitative Information by Edward R. Tufte (1983-12-23)
Edward R. Tufte
Reading Edward Tufte
- Which books by Edward Tufte can I find here?
This page currently brings together 18 catalogue works, including The Visual Display of Quantitative Information, Envisioning Information, Visual Explanations. This is a selection from our catalogue, not necessarily a complete bibliography. Open a work to compare editions and reviews.
Search this author- How are these books ordered?
The list uses catalogue reading-popularity data to put widely read works first. That is a discovery aid, not a claim that the first result is the author's best book or a recommended reading order.
- Where should I check a particular edition or translation?
Open the book's catalogue page and compare publisher, year, format, language and ISBN. Different editions of the same work can have different translators, introductions and page counts.